
ADATA

Quality Report
Designed an on-premise quality reporting platform for a global memory manufacturer, replacing a 15-day manual process with real-time, fully auditable reporting.
The system directly protected ~US$200M in quality-driven decisions and eliminated a critical single point of failure in production operations.
Type
Internal SaaS plataform
Timeframe
Feb 2023 - Dec 2024 (3 phases)
My role
Product Designer (end-to-end) - consulting via Venturus
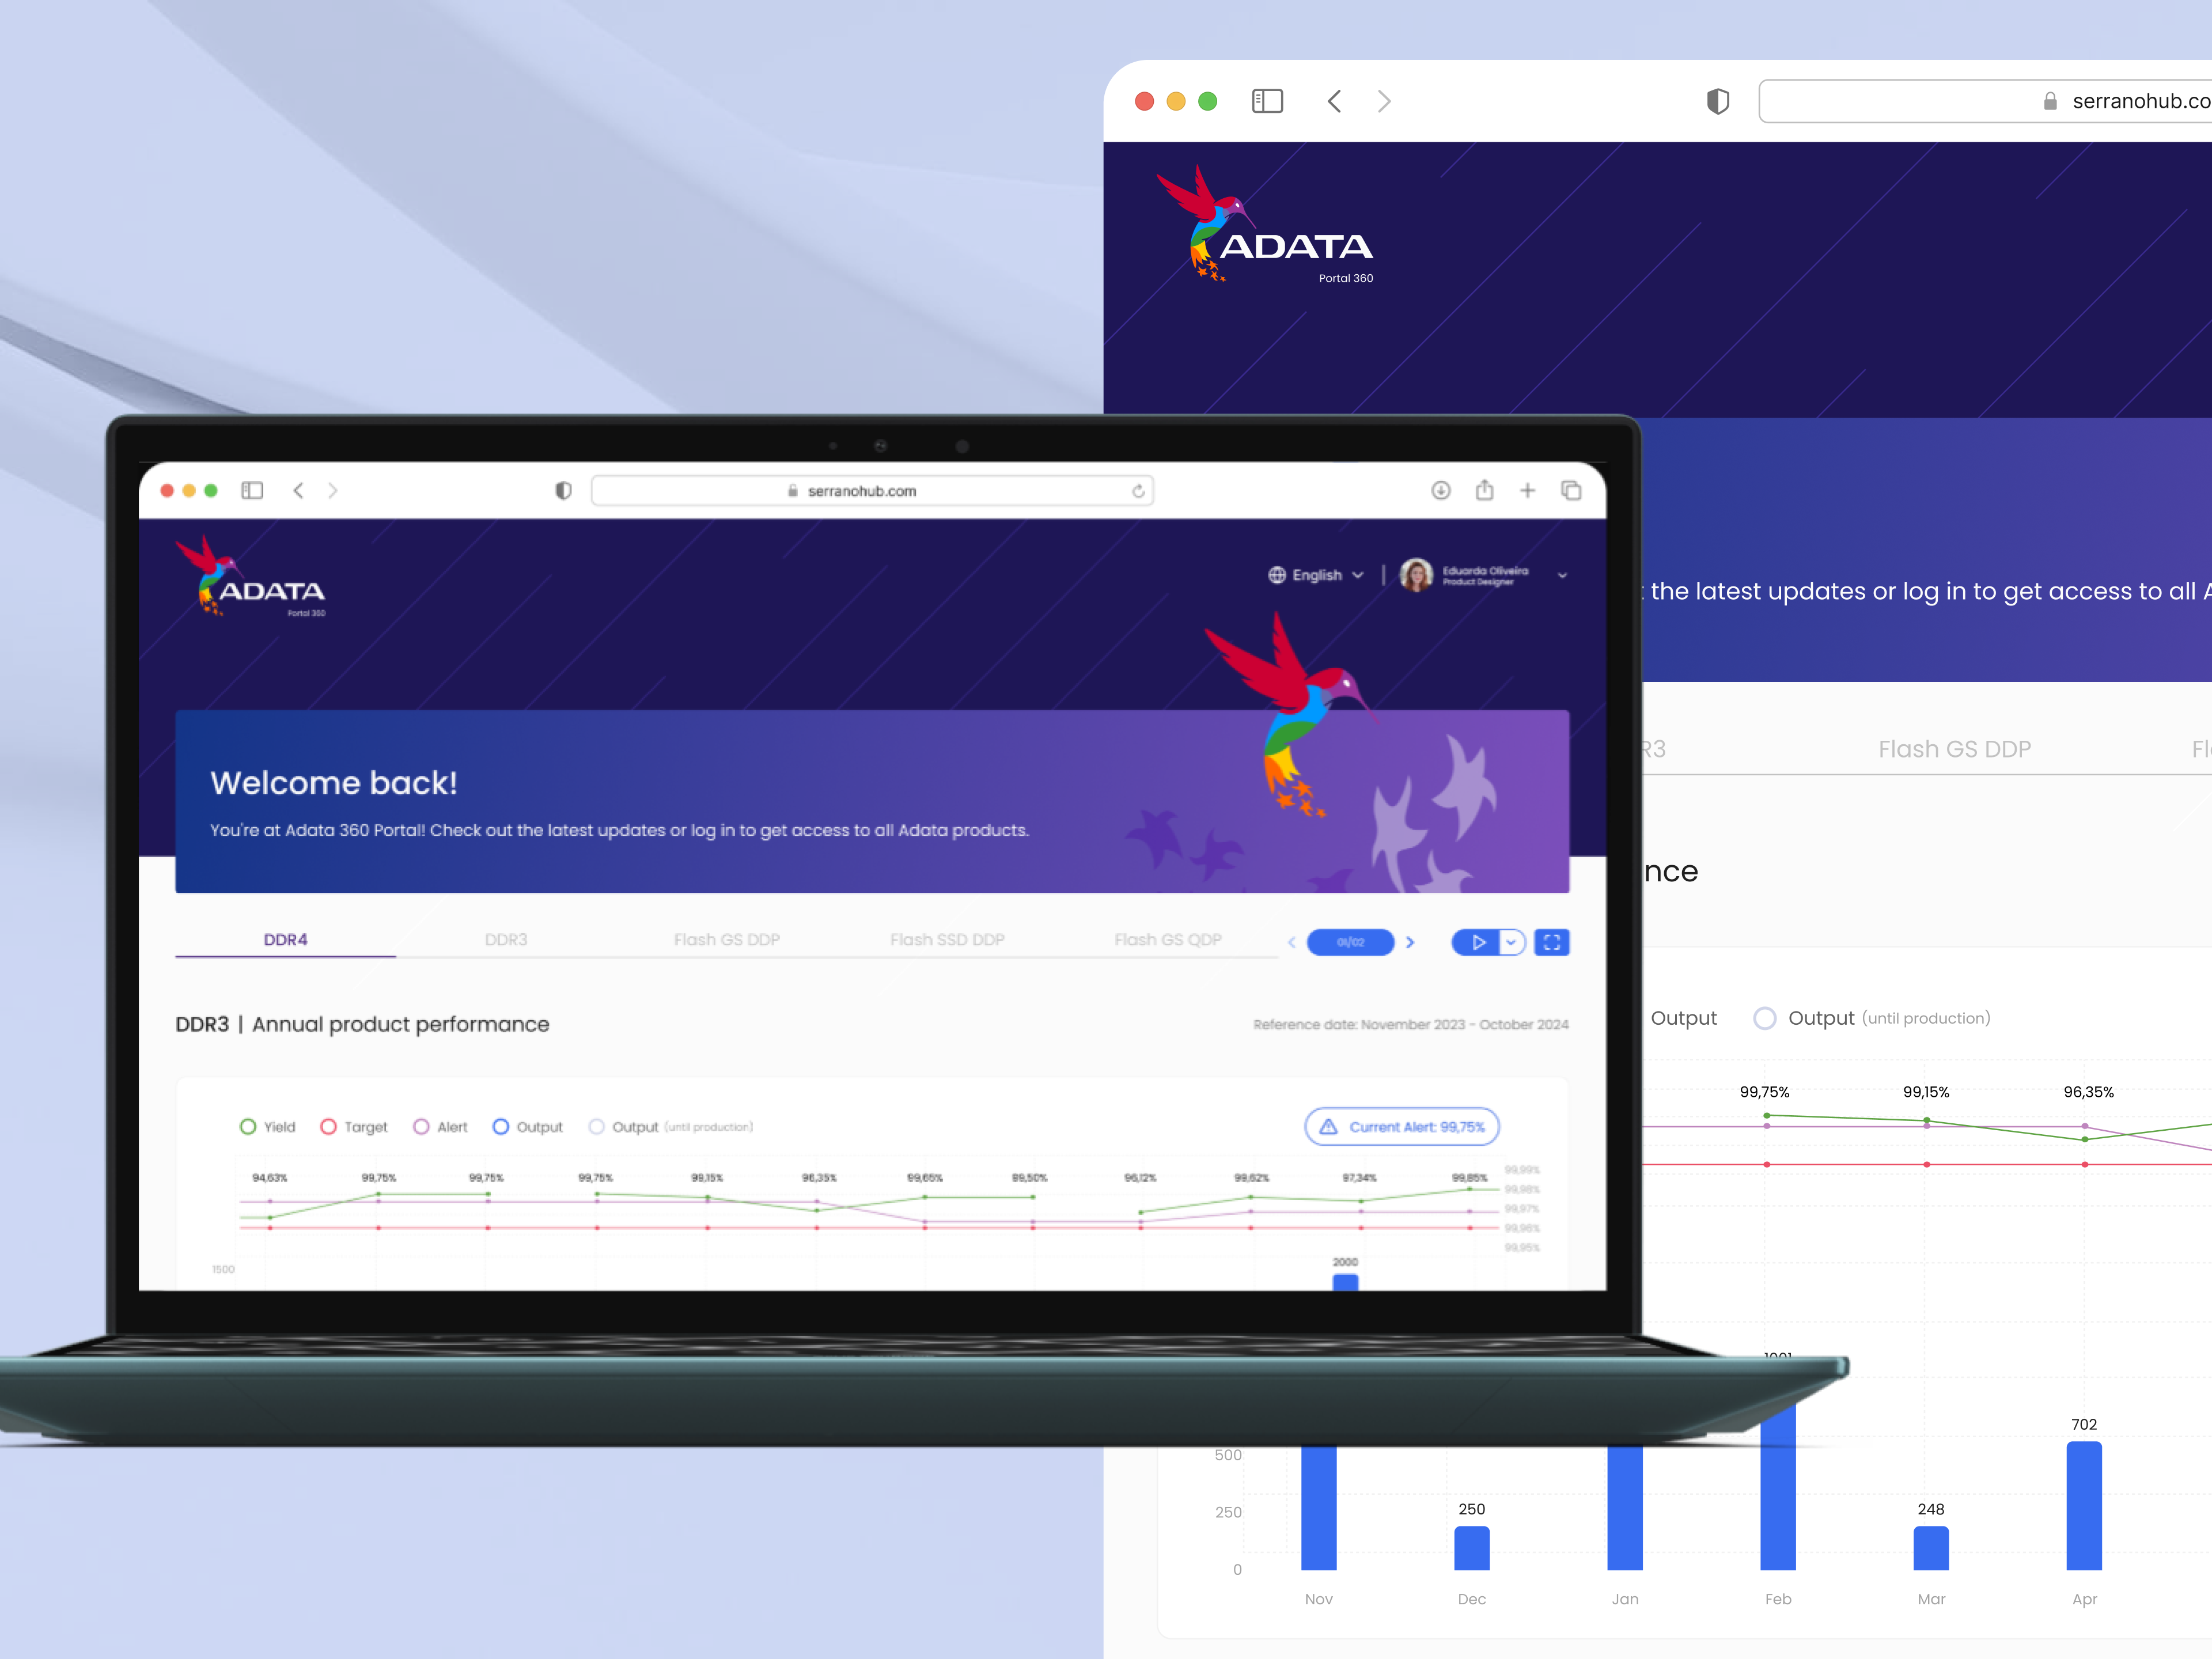
Overview
ADATA's quality reporting process was a 15-day manual operation controlled by a single specialist, with ~US$200M in quality-driven decisions depending on spreadsheets and tacit knowledge. I led the end-to-end design of the platform that replaced it, in three phases, over 1 year and 10 months, inside a security-restricted, on-premise manufacturing environment.
The users
The platform was designed for a multi-role, multi-context environment, balancing the needs of quality management, engineering, operations, and leadership. Each role interacted with the same data at different levels of depth and responsibility, requiring carefully designed permissions, workflows, and representations.
The problem
Quality reporting at ADATA depended on a single specialist with decades of tacit knowledge, working on raw, low-level production data that required manual interpretation. This created a fragile system where speed, accuracy, and scalability were structurally limited, and where reporting quality directly exposed the organization to operational risk, financial impact, and loss of trust. Solving this problem required more than digitization — it demanded redesigning how data, responsibility, and decision-making flowed across the system.
The problem

Manual Process
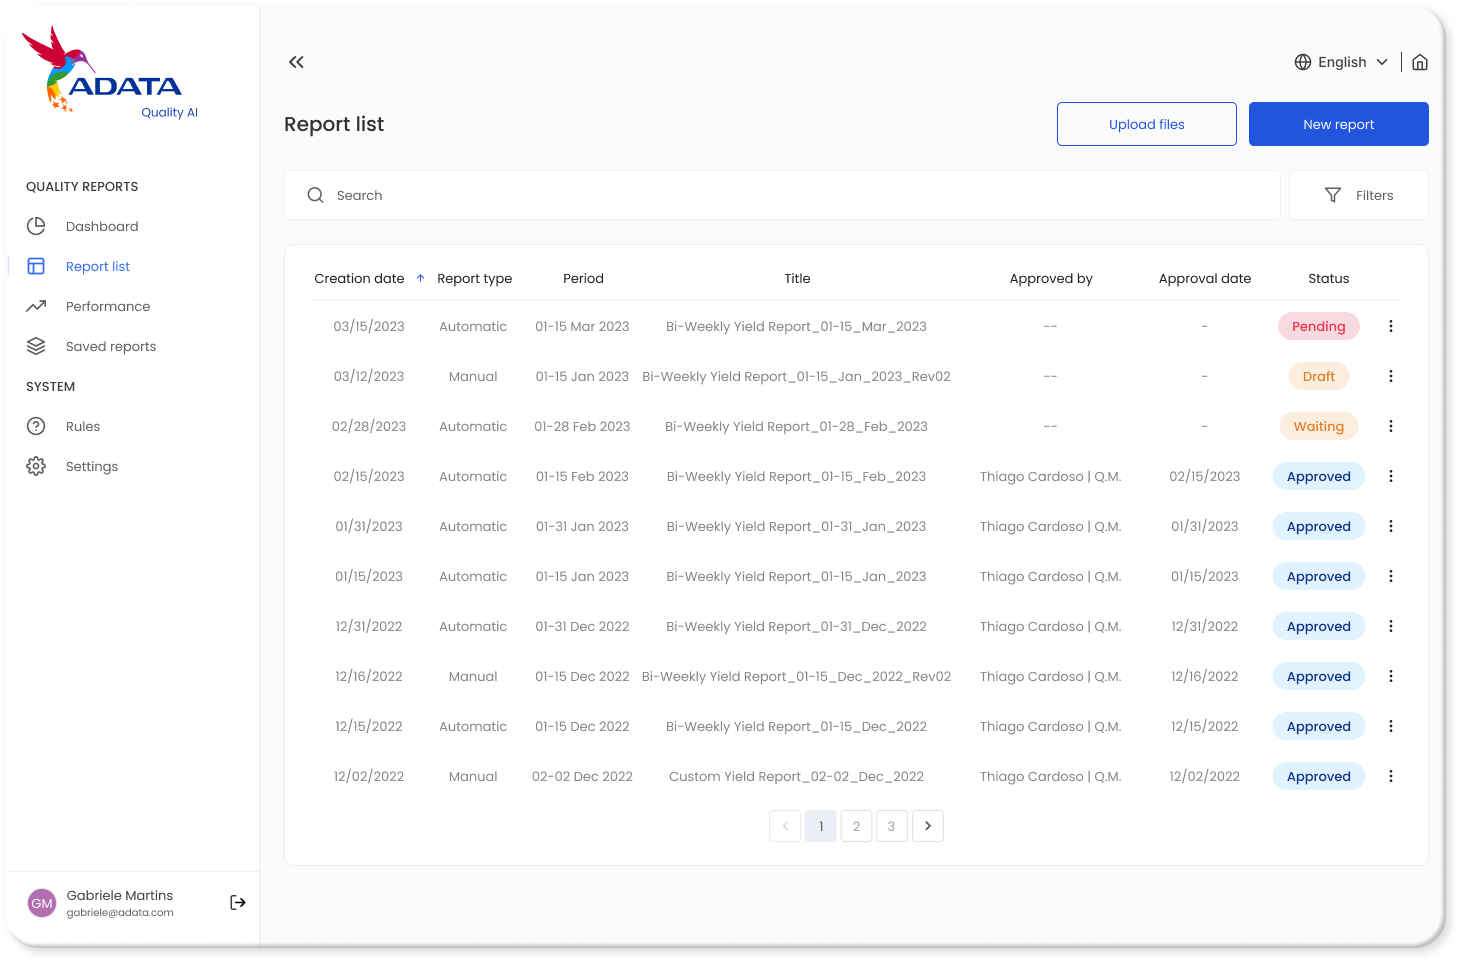
The entire data verification and consolidation process was performed manually, with calculations and business rules known only to the manager.

Data Complexity
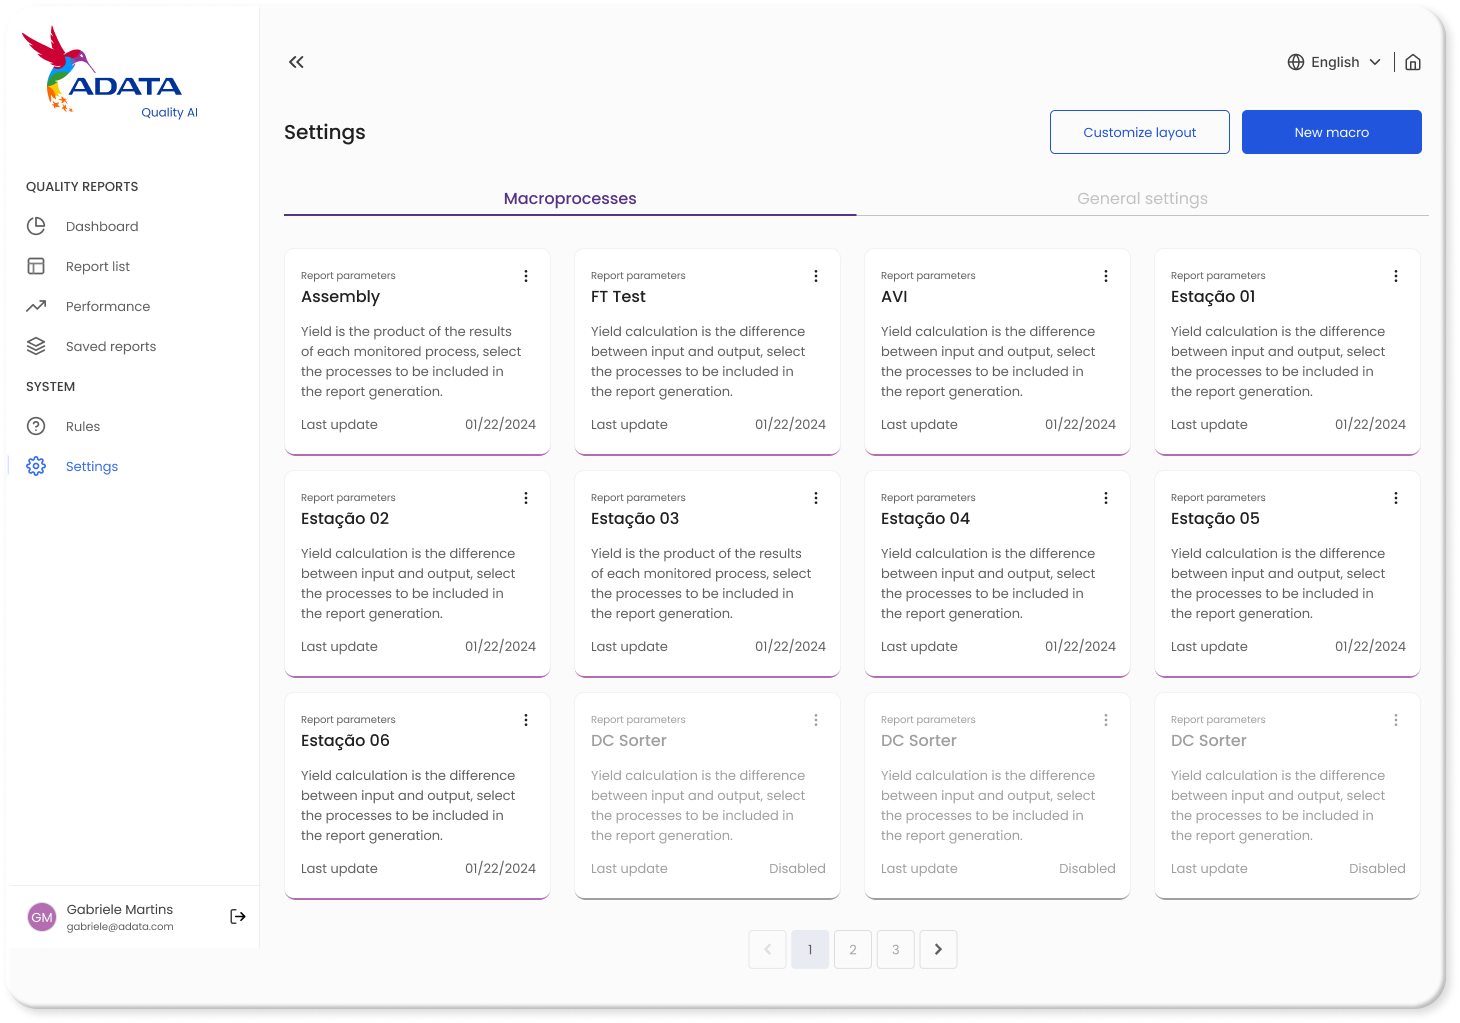
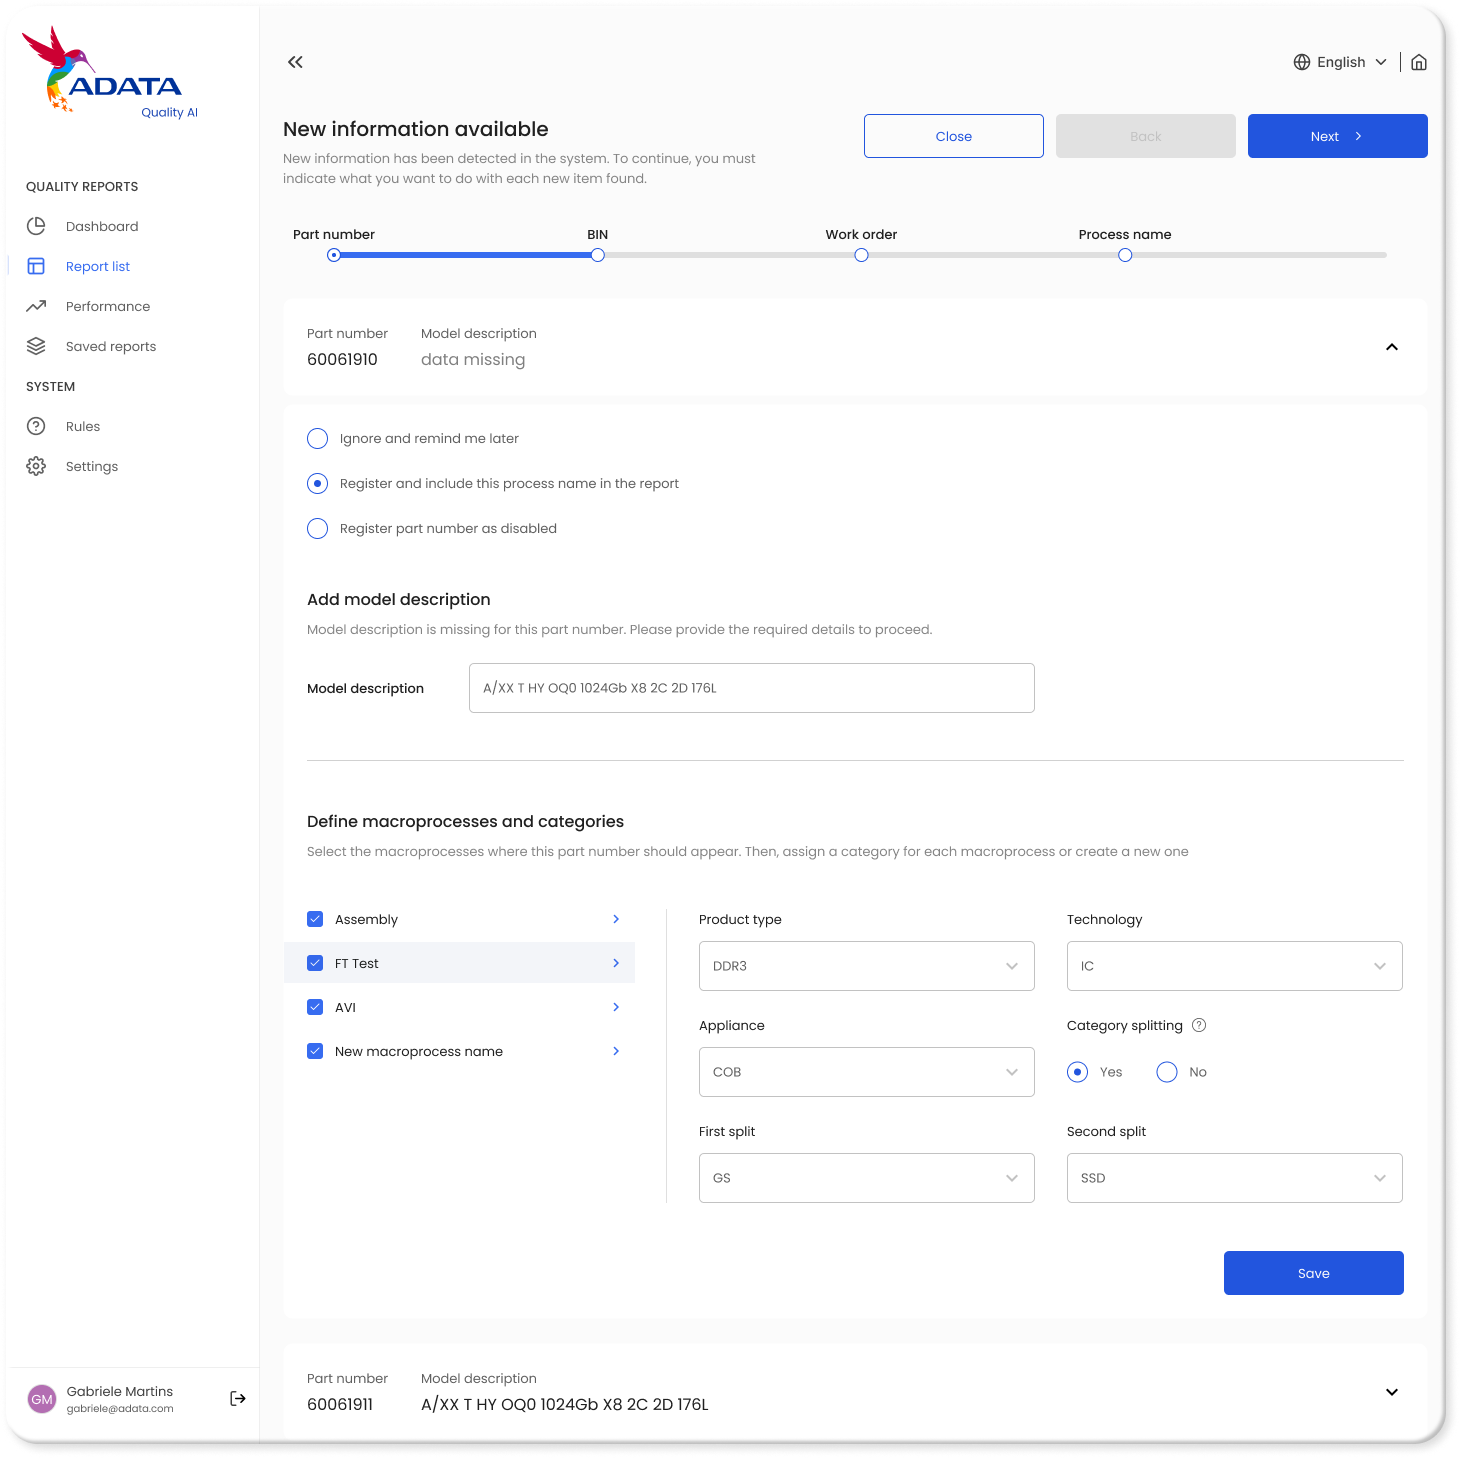
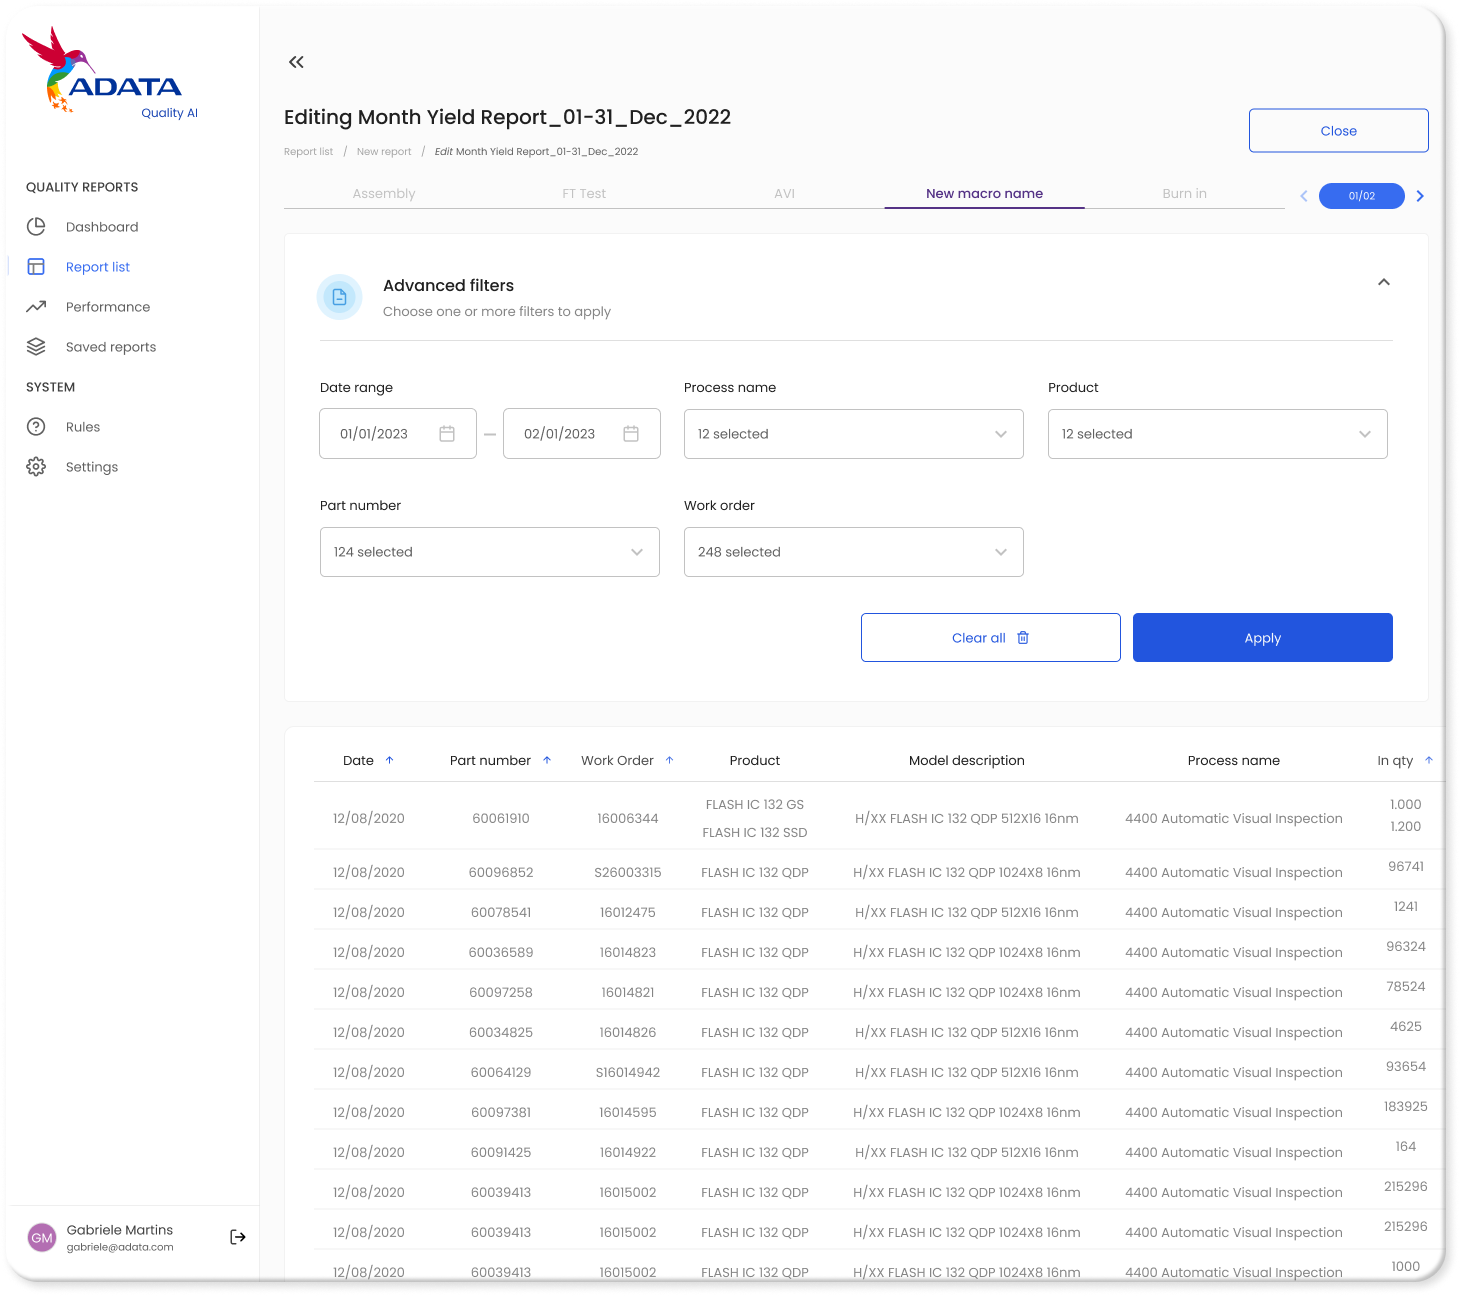
Each of ADATA's 14+ product lines had distinct calculation rules and machine-specific tolerances, none of which were formally documented. Capturing this knowledge and translating it into a configurable system was the core design and systems challenge.

High Risks
A single point of failure, one specialist holding all tacit knowledge, meant that errors in data interpretation could go undetected, directly exposing the organization to financial loss, product recalls, and reputational damage with global clients.

Goals &
Success criteria
Not all goals were created equal.
Here's how we navigated conflicting priorities.
At the start of the project, the client framed the problem as 'we need reports faster.' My first job was to understand whether speed was the real goal, or a proxy for something deeper. Through stakeholder interviews and analysis of past reporting failures, three distinct goal layers emerged: what the business needed to protect, what users needed to do their jobs, and what would tell us, objectively, if we'd solved the right problem.
The problem
Discovery Process
Validate first.
Design later.
The discovery phase focused on validating assumptions and understanding risk. Initial hypotheses around speed and digitization were tested against real usage, data structures, and operational constraints, revealing deeper systemic issues related to reliability, tacit knowledge dependency, and decision risk at scale. Insights from research were synthesized into clear product directions, guiding what to build, what to simplify, and what to deliberately avoid, ensuring the solution addressed root causes rather than surface symptoms.
Three hypotheses tested — three pivots made
The structural pivot — inverting the decision tree
Flash products don't go through Wire Bonding at all — a fact the old structure made invisible. The new tree made it obvious at a glance, without needing institutional memory.
Structuring & Ideation
Sketching the Future
Starting with dynamic whiteboard sessions, I rapidly transformed raw ideas into low-fidelity wireframes in Figma. This collaborative approach allowed immediate validation with stakeholders, ensuring every concept was aligned with business needs.From rough sketches to digital prototypes – each step iterated in real-time based on stakeholder feedback.
The problem
Translating ideas into
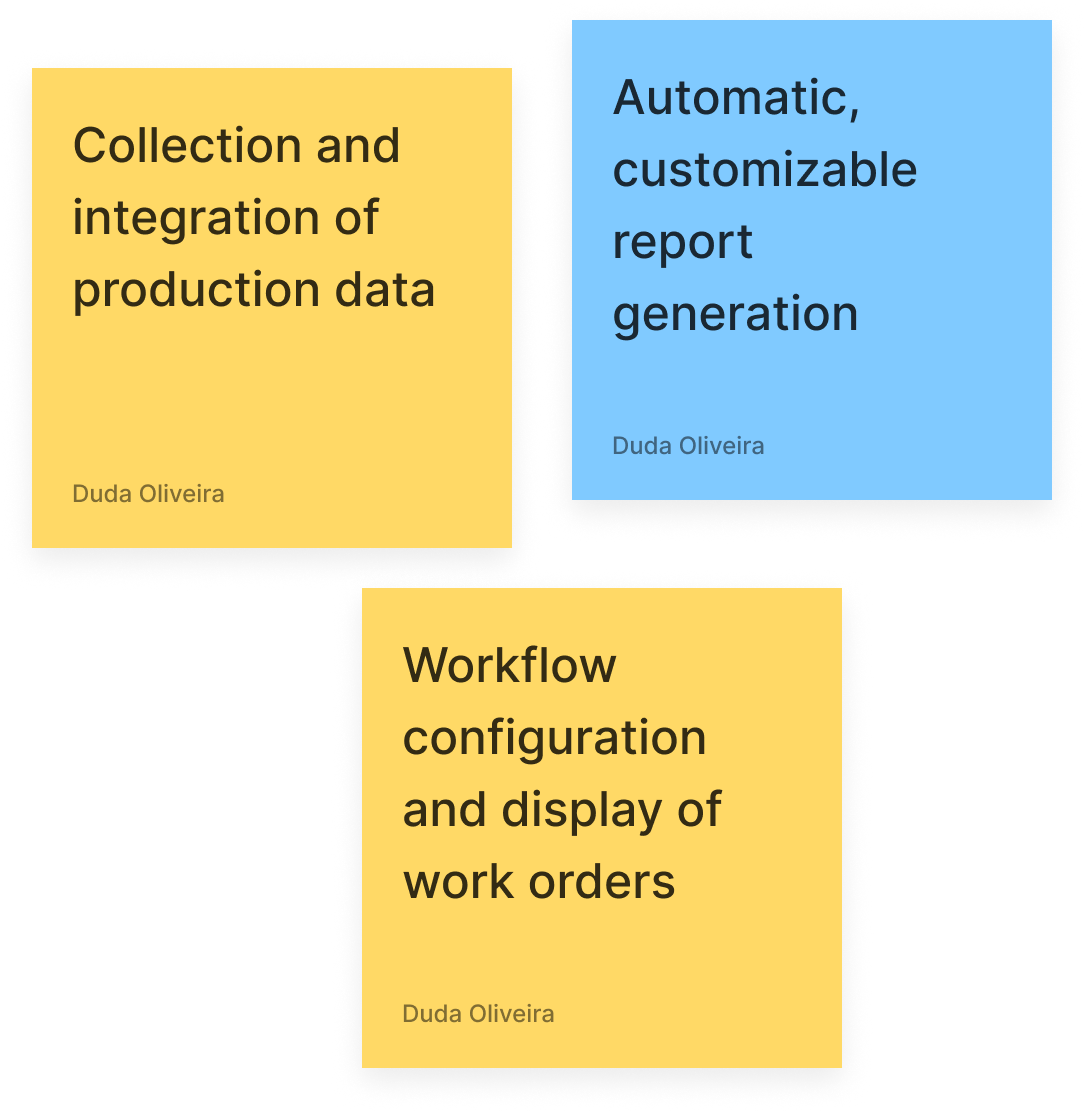

digital prototypes
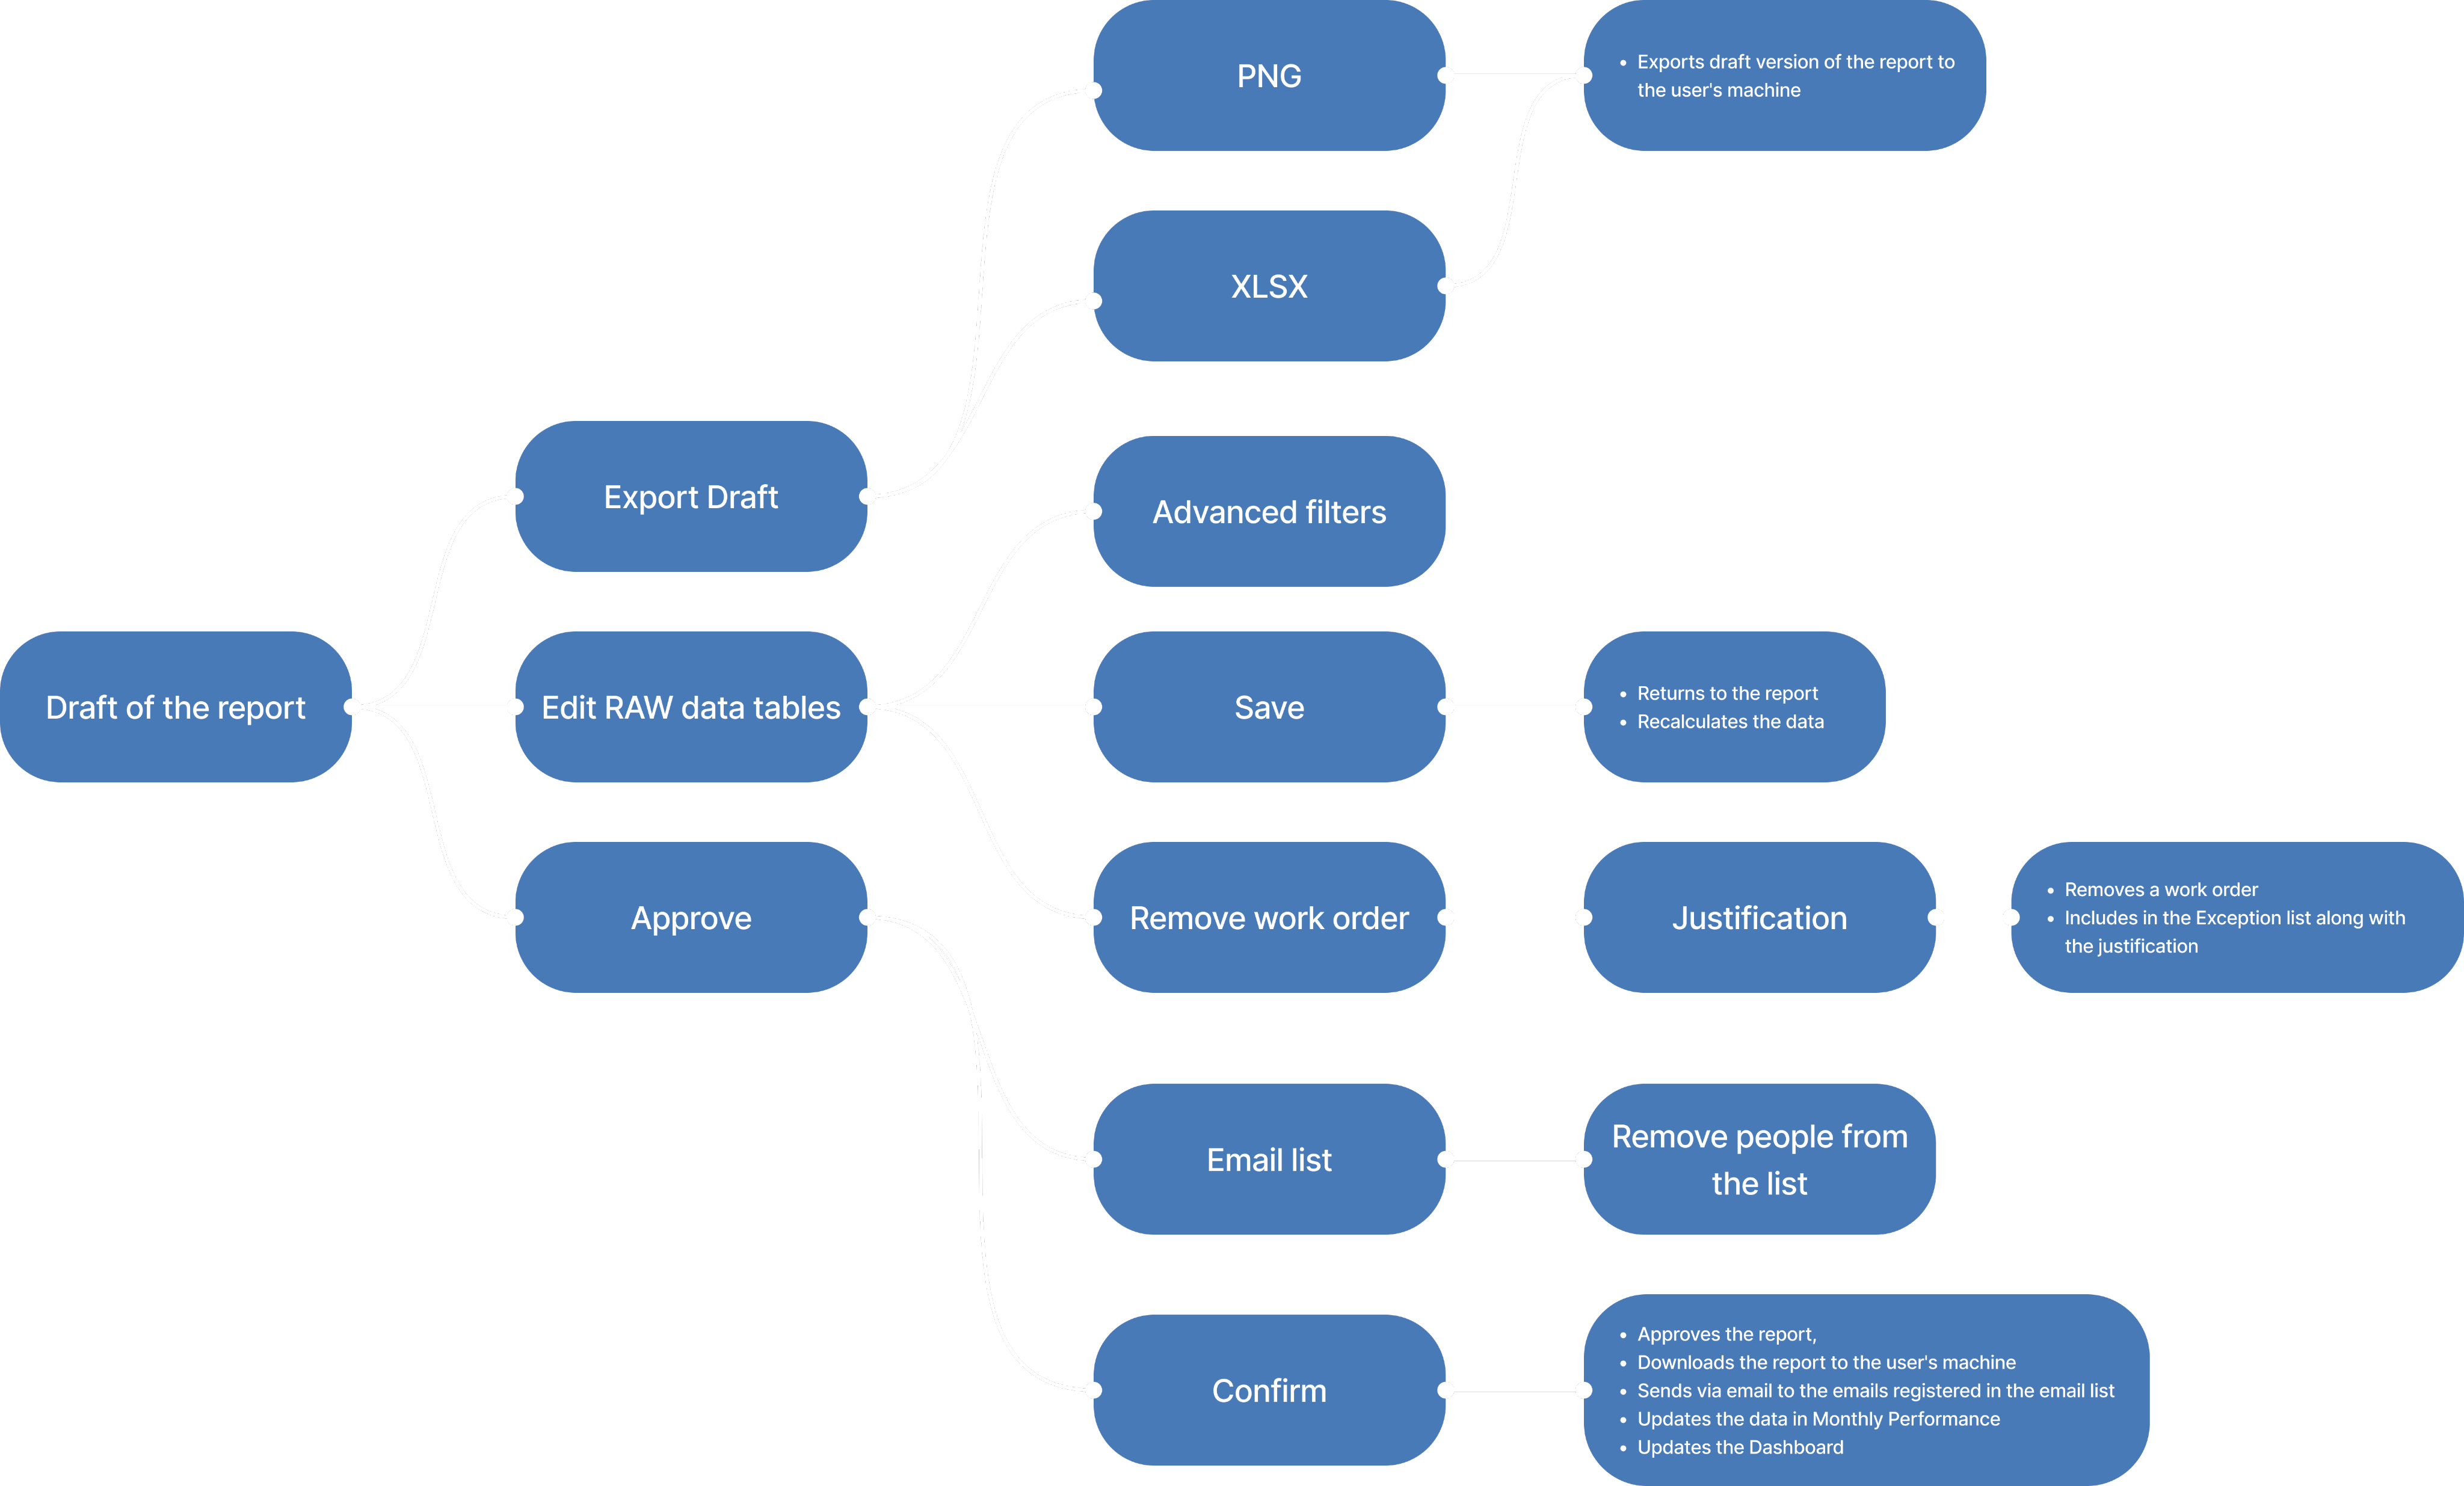
Mapping Every Detail
Every user flow, rule, and automation was meticulously documented. This blueprint provided the technical team with the clarity needed for flawless backend integration, ensuring that no detail was overlooked
Detailed documentation bridges design and development, making complex workflows easily understandable.
Scaling the solution for tomorrow
Consistent Visual Language
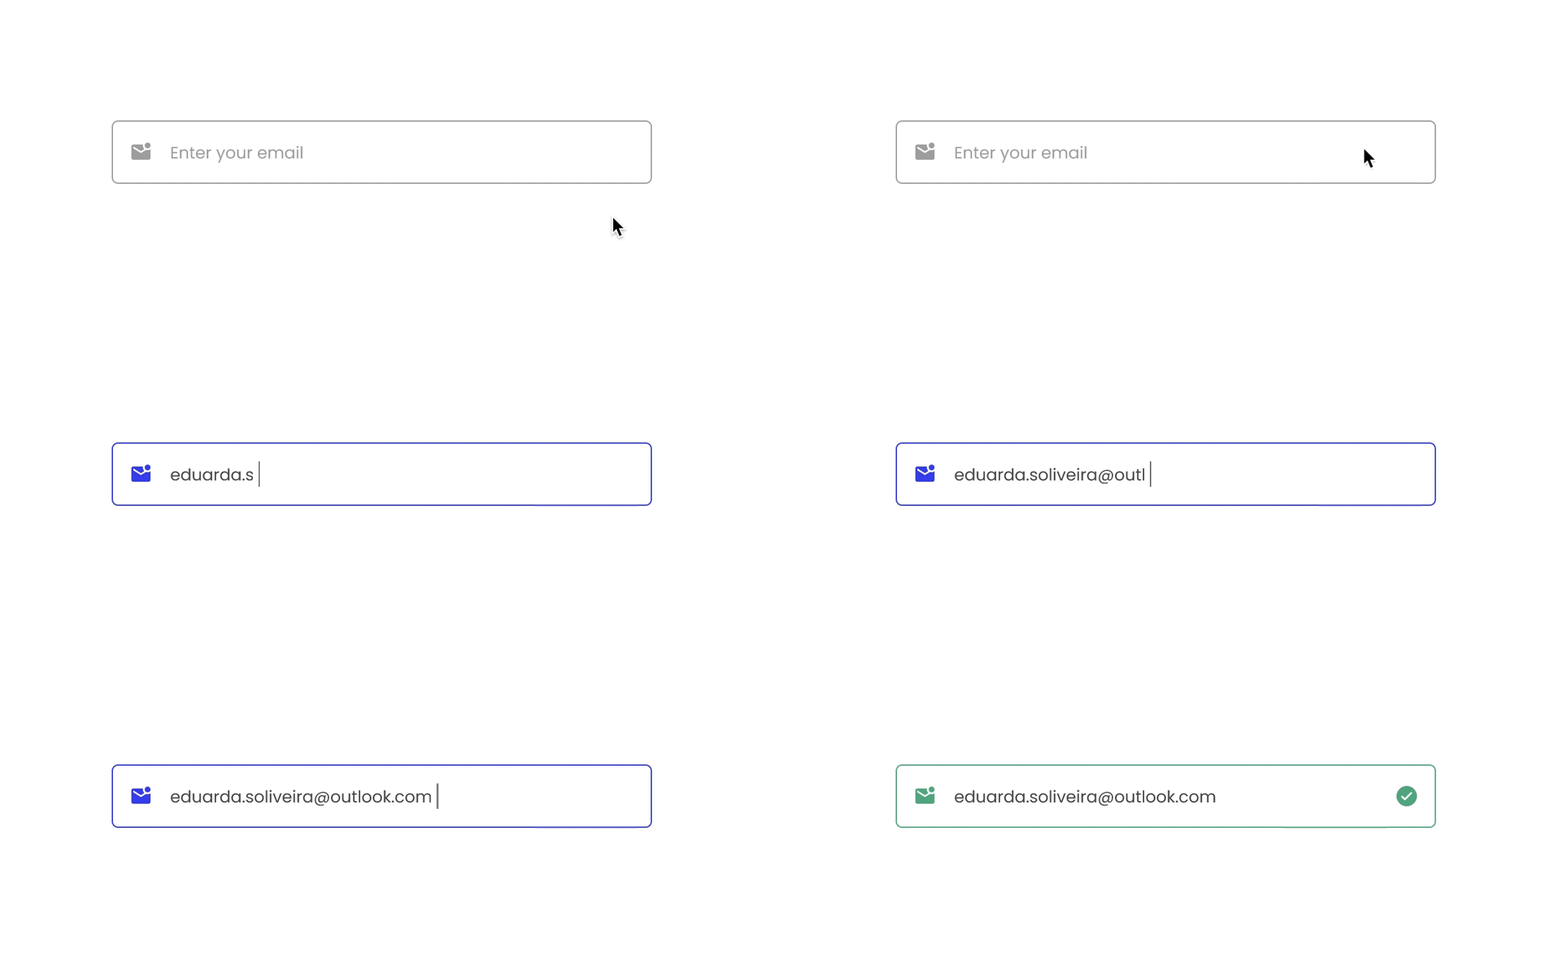
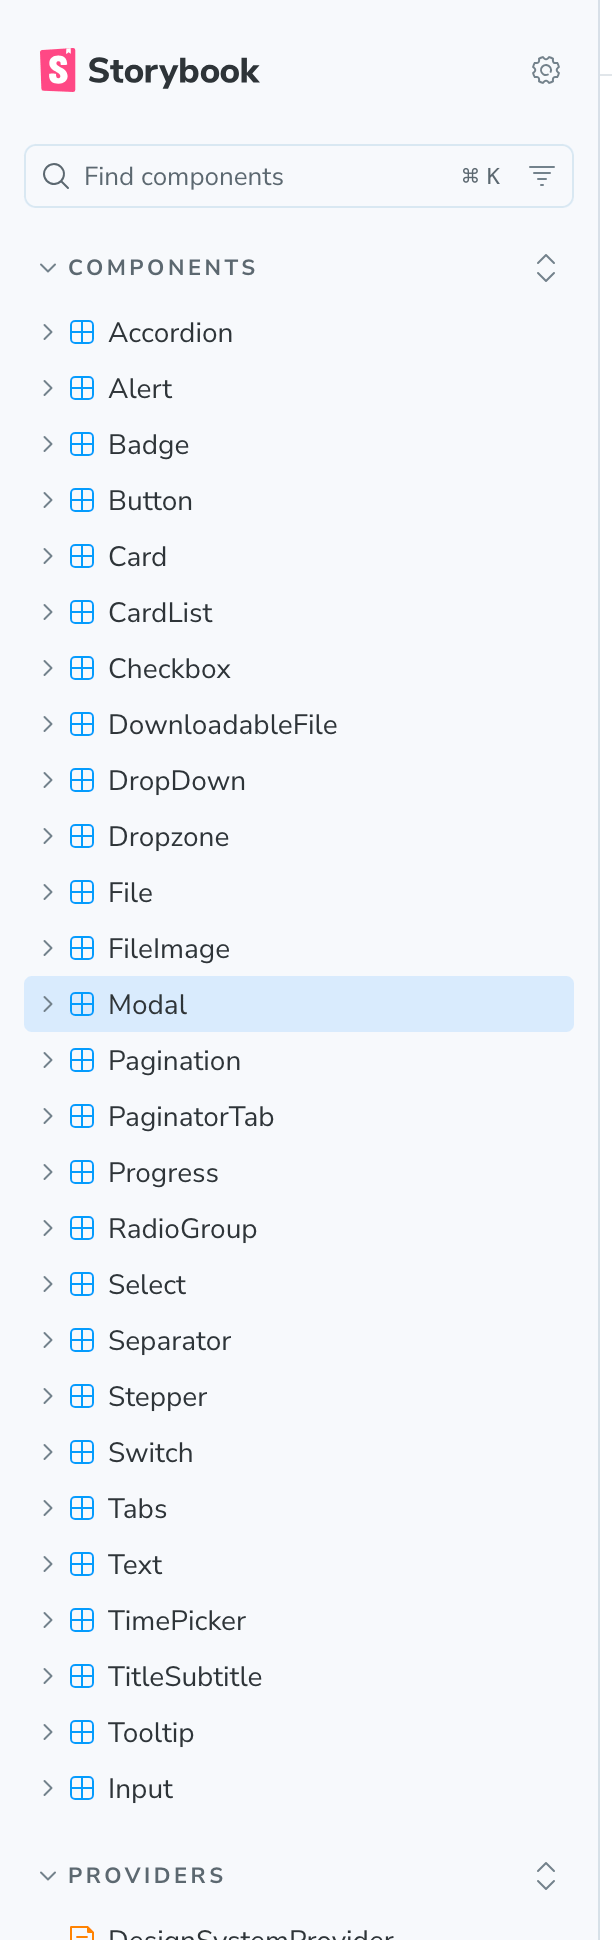
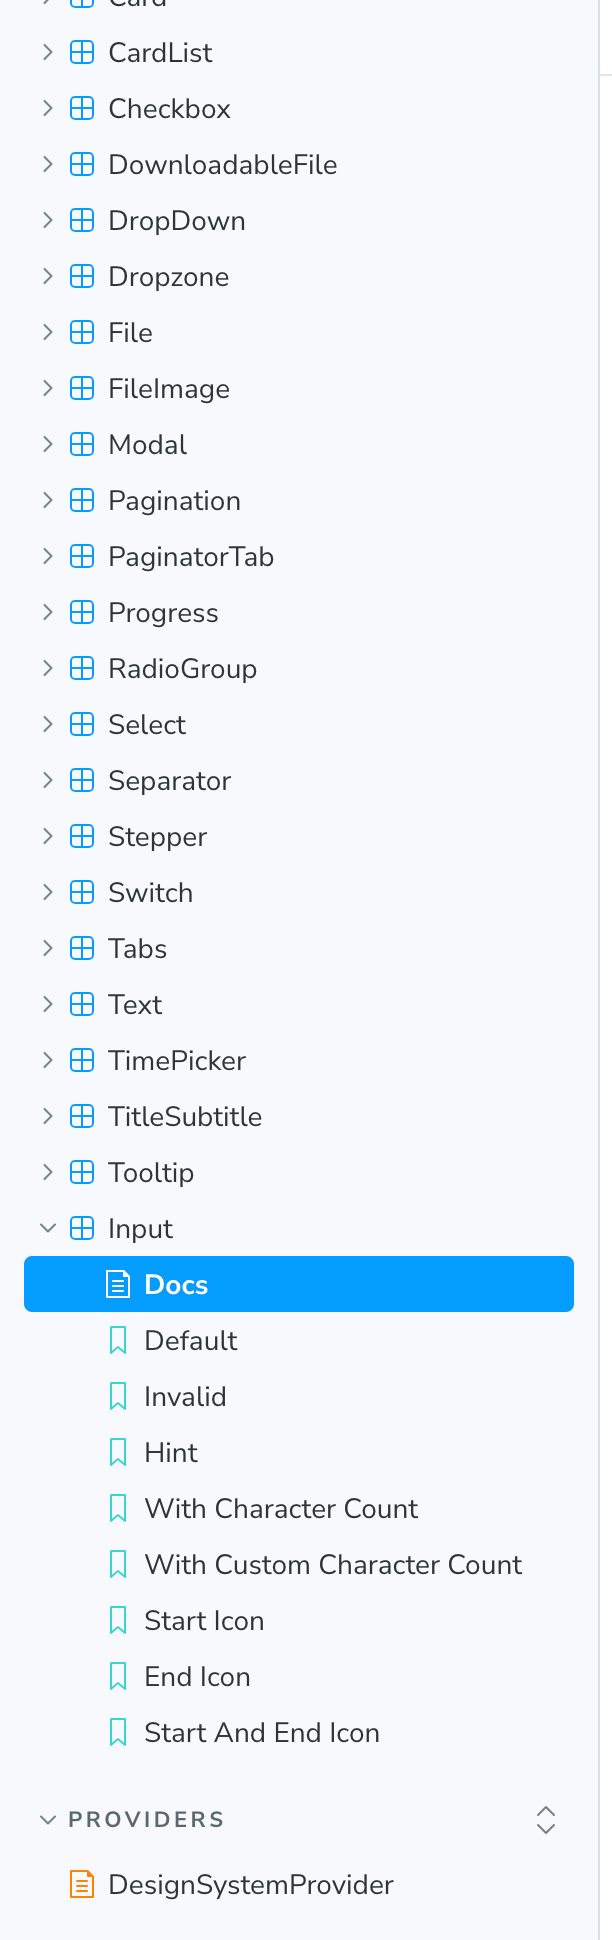
Leveraging the power of Chakra UI 2.0, I contributed to the development of a robust design system with reusable components and micro-interactions. This collaborative approach streamlined the design process and ensured a consistent, scalable user experience across all touchpoints.Reusable design components create a unified, intuitive interface – simplifying complex requirements into a clear visual language.
Prototyping&Testing
Weekly Iterations in Motion
Every week, I bring new iterations to life. Early designs, sketched and refined, are quickly transformed into interactive prototypes. By presenting these prototypes to stakeholders, I gather real-time feedback that drives swift and effective design improvements.
Data-Driven Validation
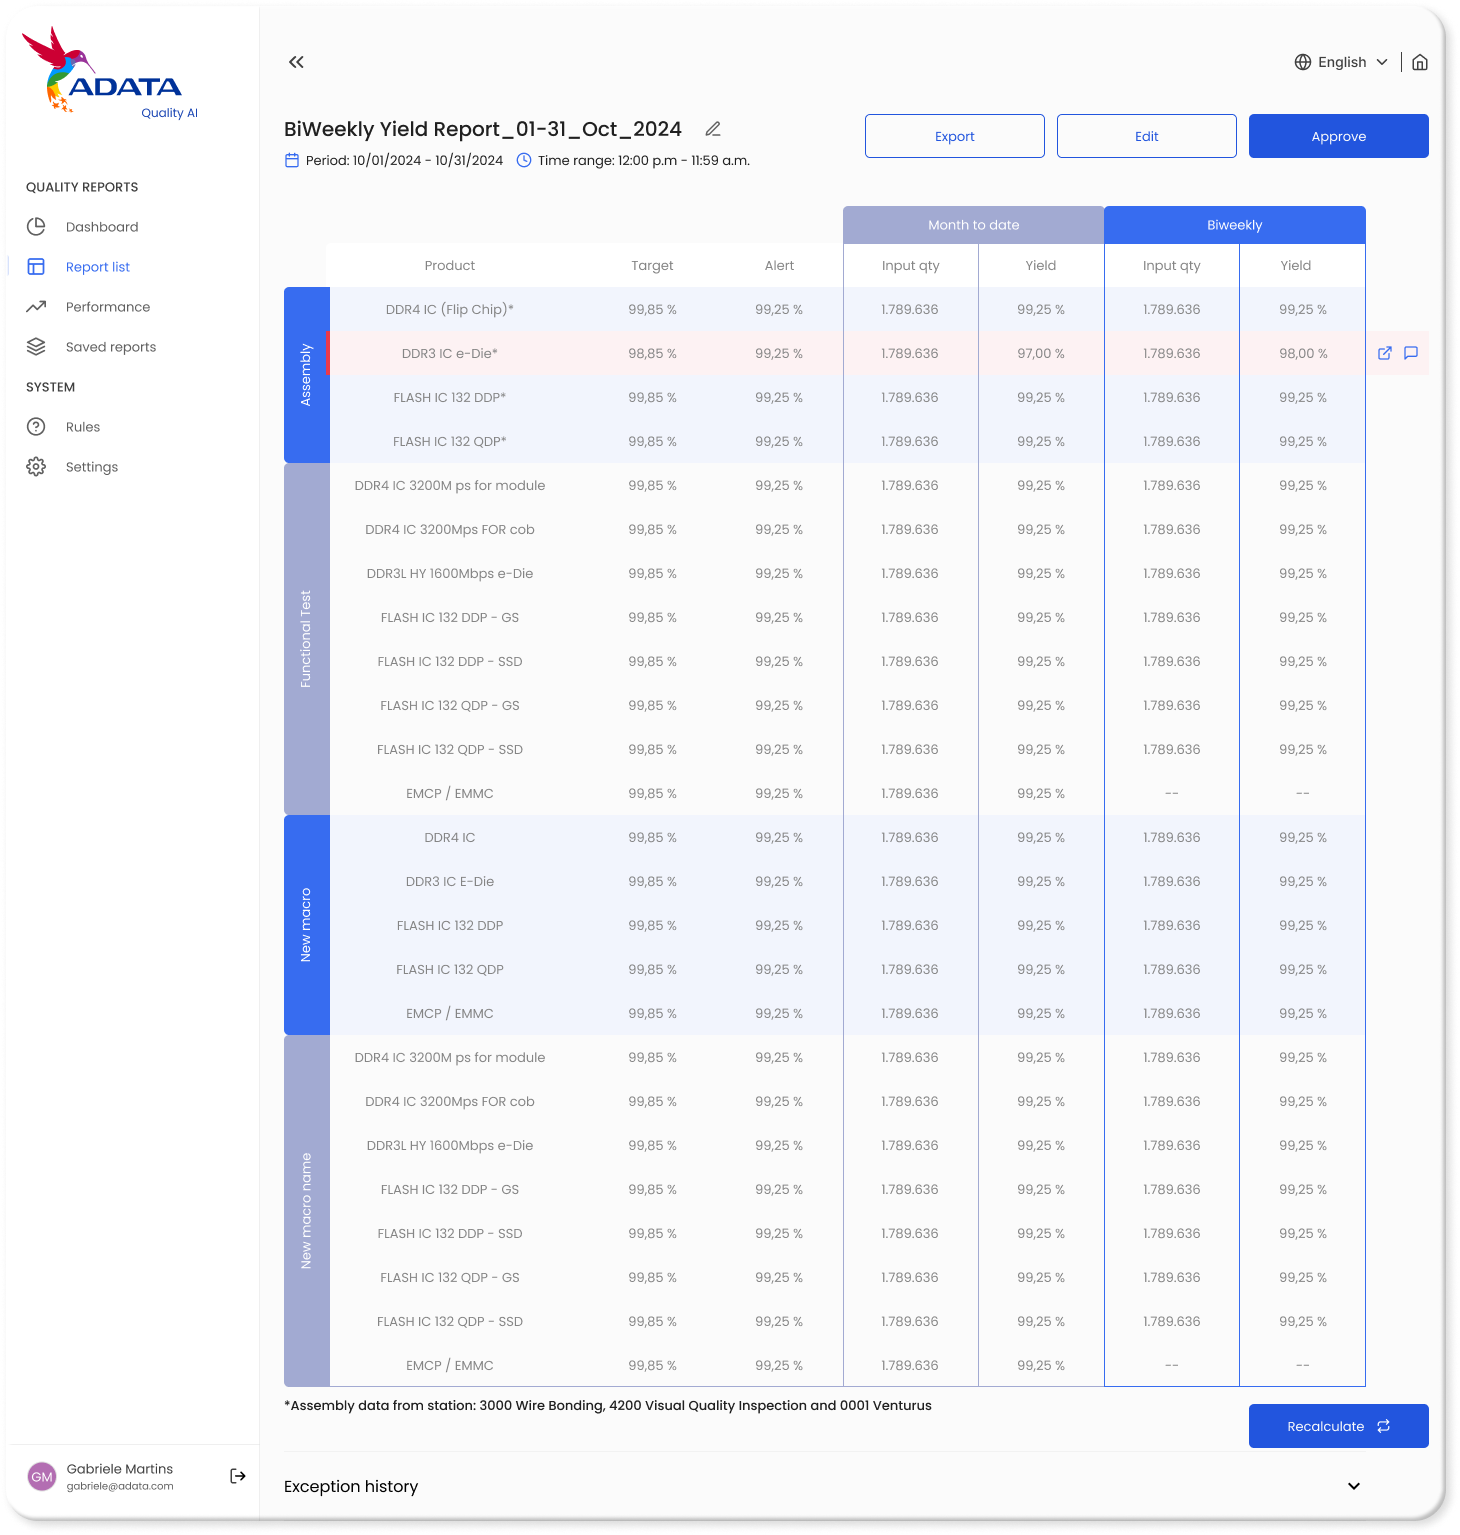
Parallel to prototyping, I validate each design iteration using comprehensive data tests. Detailed reports compare historical performance with manual process benchmarks, revealing critical gaps and guiding precise adjustments. This rigorous testing ensures that every design update is backed by quantifiable results
The problem

Solution Definition
The transformation was both systemic and measurable.
For the product ecosystem, the Design System improved cross-platform consistency and reduced engineering’s design maintenance workload by 35%, enabling faster releases across the entire company. The migration to Shadcn modernized the stack and gave developers far more flexibility and speed.
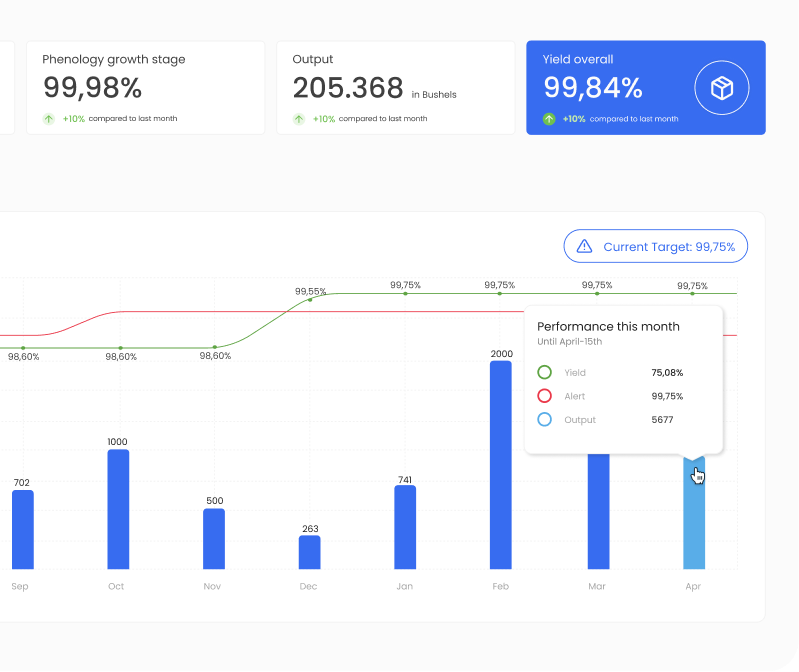
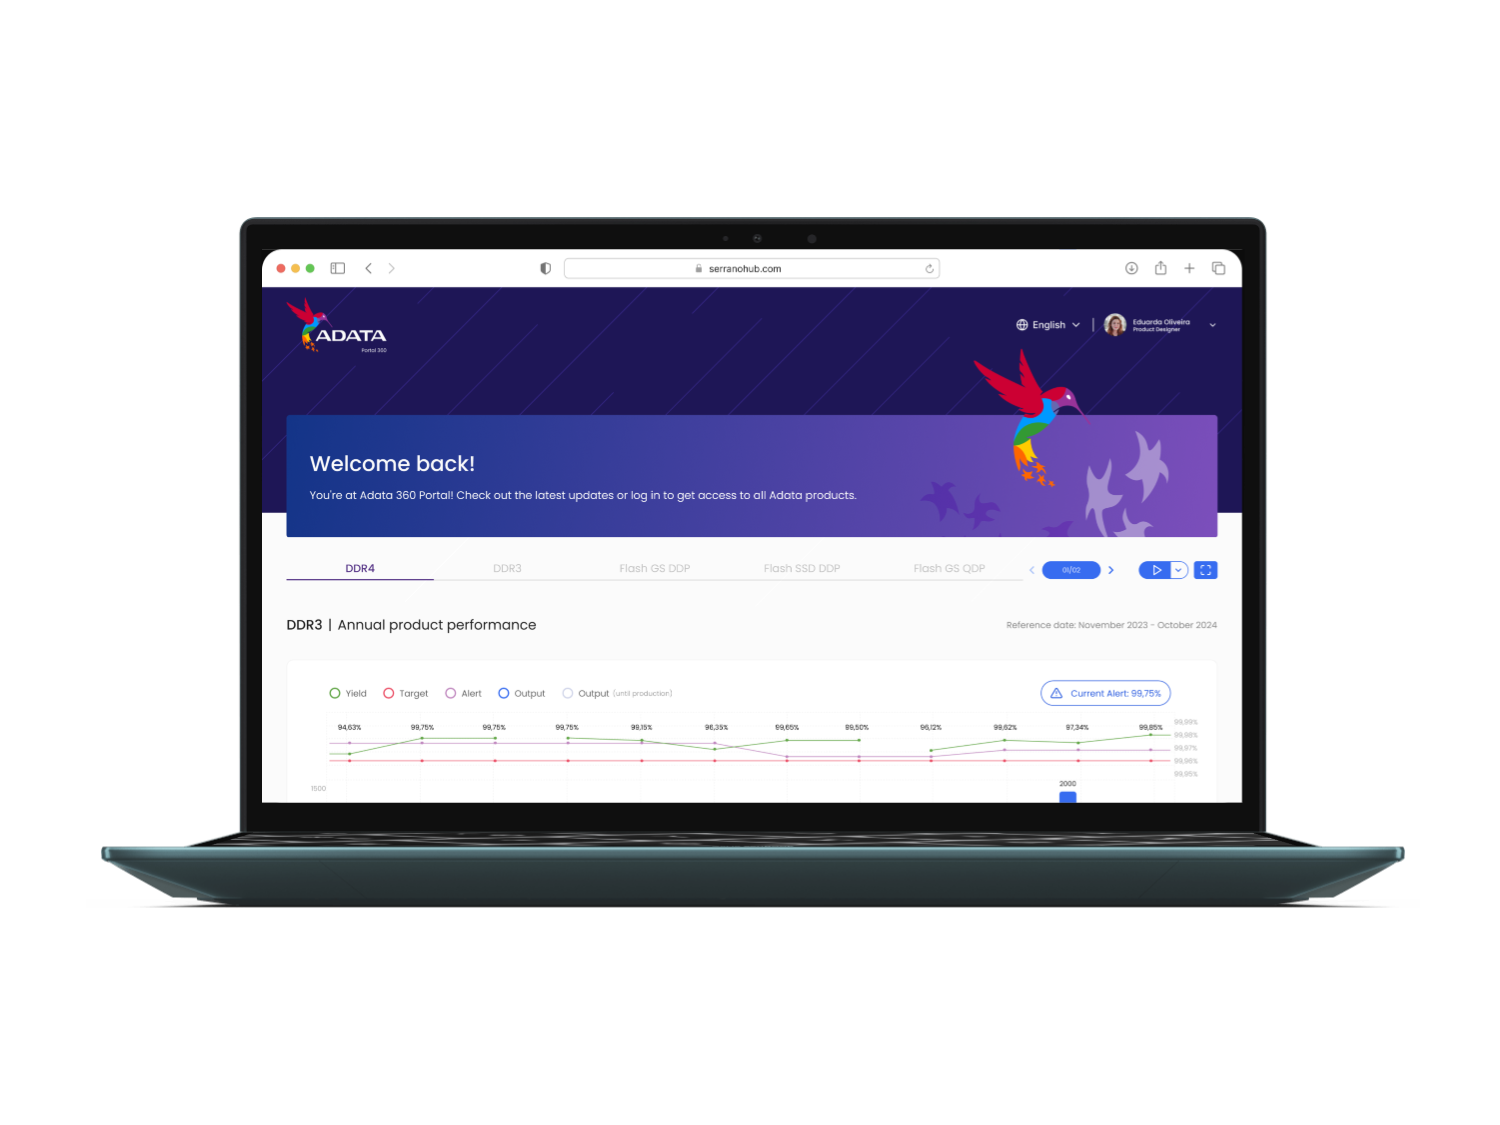
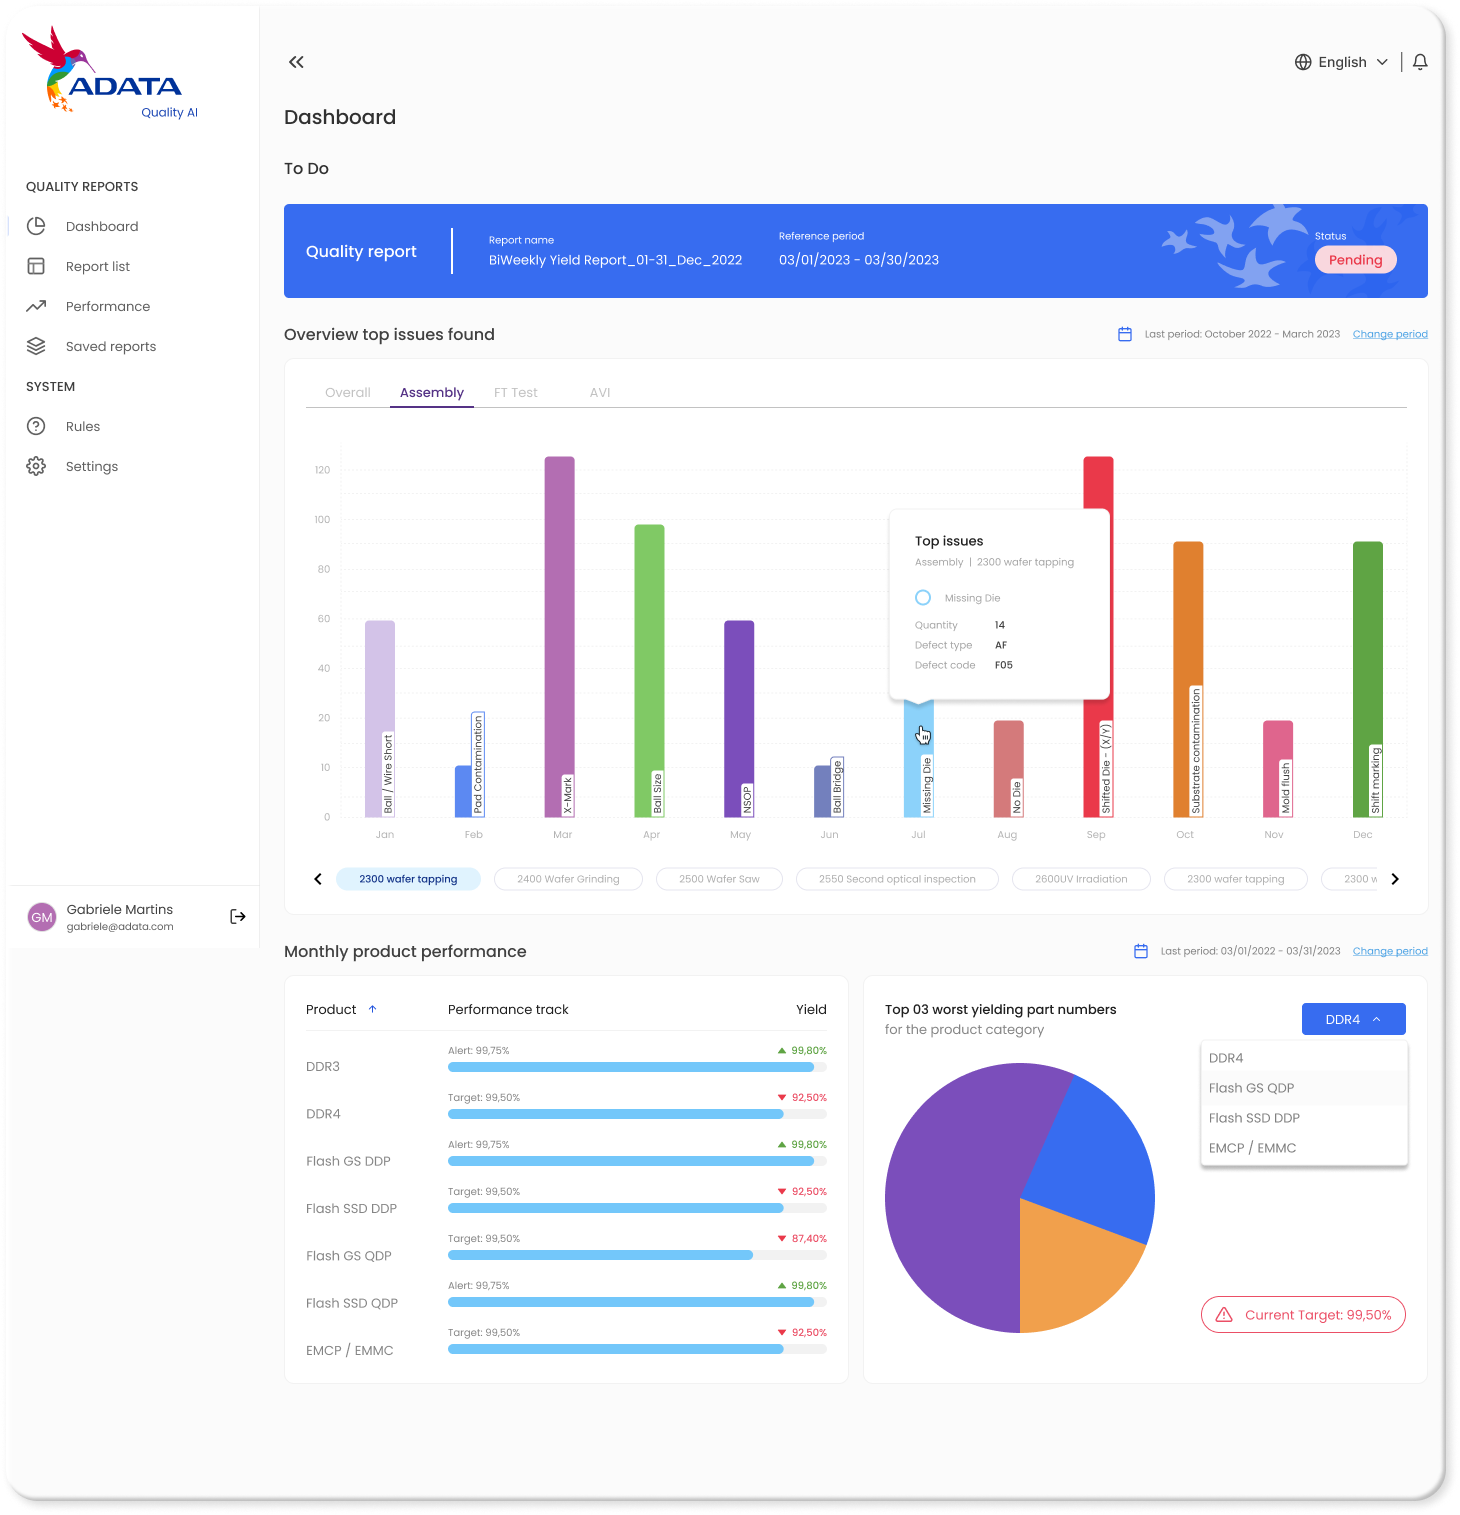
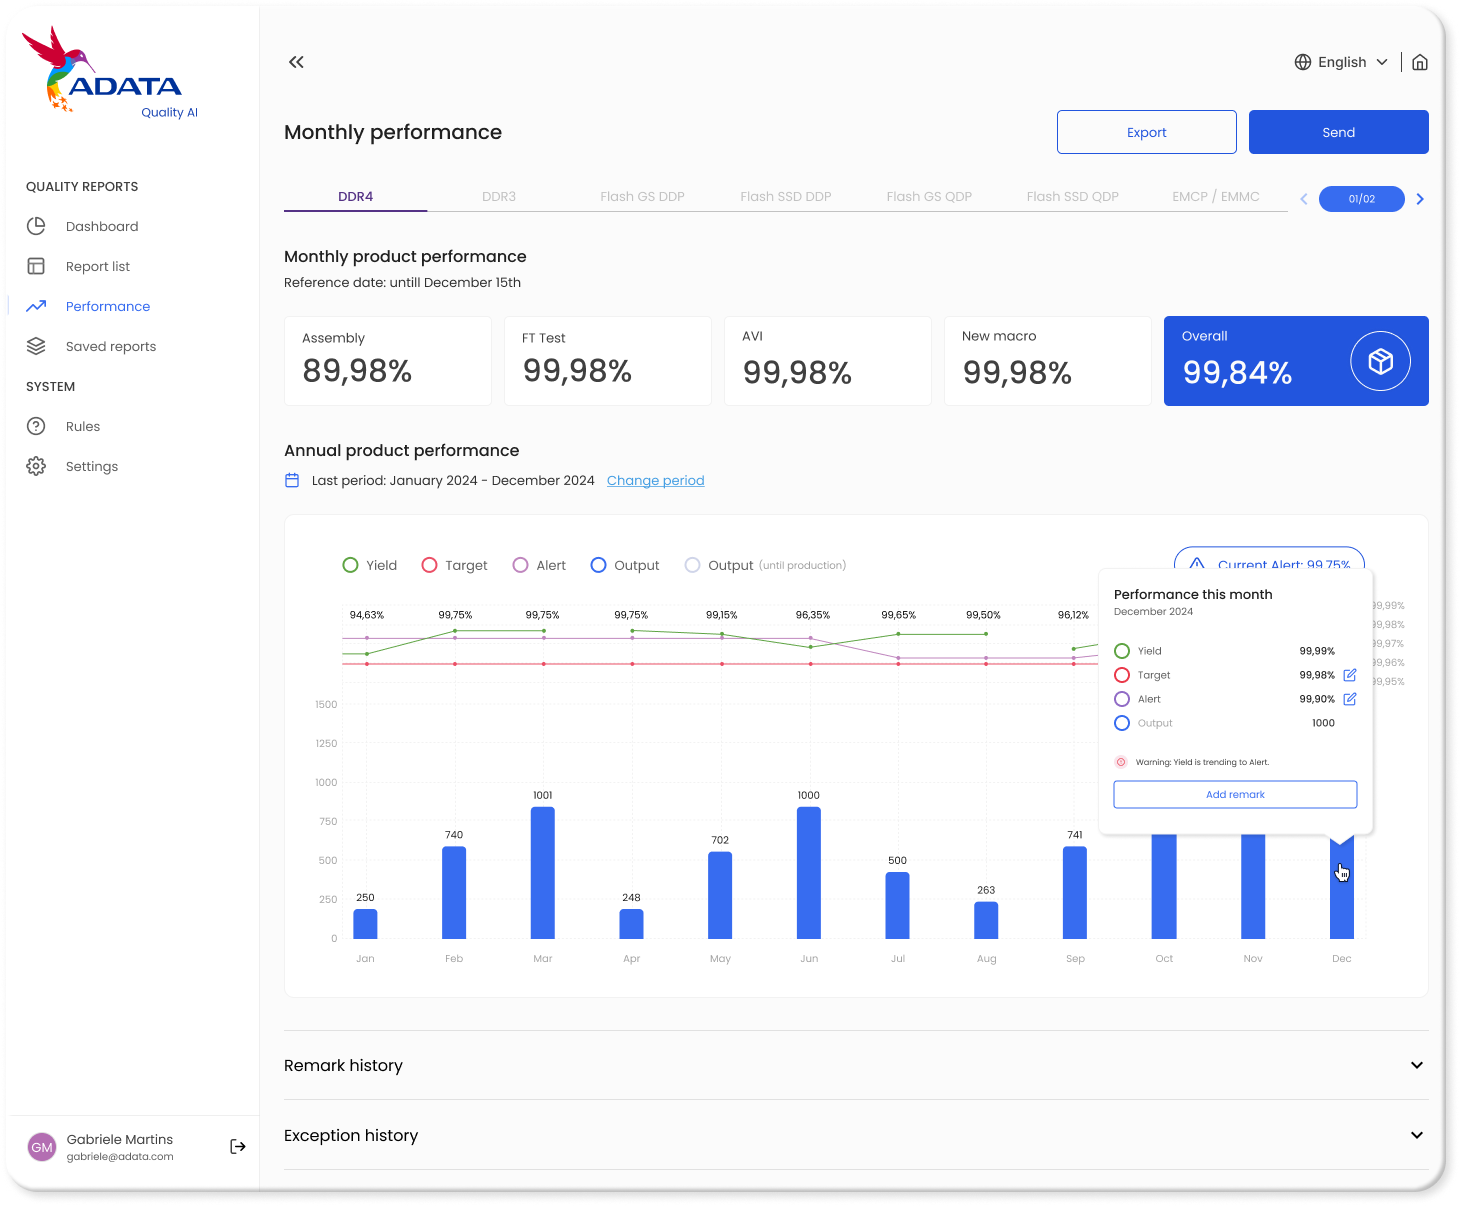
Operationally, products built on top of this ecosystem delivered significant business outcomes. The automated Quality Reporting platform reduced report delivery time by 99%, unlocking real-time insights for manufacturing teams. The redesigned SPC workflow reduced machine downtime from hours to minutes, enabling earlier defect detection and improving operational reliability.
Most importantly, ADATA shifted from a scattered toolset to a cohesive SaaS ecosystem, where systems talk to each other, share data, and reinforce a unified operational flow. This ecosystem approach now supports how the organization builds, scales, and maintains every new product going forward.



serranohub.com


English


Eduarda Oliveira
Product Designer


DDR4
DDR3
Flash GS DDP
Flash SSD DDP
Flash GS QDP

01/02


DDR3
|
Annual product performance
Reference date: November 2023 - October 2024

1500
1250
1000
750
500
250
0

Yield

Target

Alert

Output

Output
(until production)


Current Alert: 99,75%


94,63%
99,75%
99,75%
99,75%
99,15%
96,35%
99,65%
99,50%
96,12%
99,62%
97,34%
99,85%
1001
250
740
1001
248
702
1000
500
263
741
2000
1452
Nov
Dec
Jan
Feb
Mar
Apr
May
Jun
Jul
Aug
Sep
Oct
99,99%
99,98%
99,97%
99,96%
99,95%
Overview
|
Monthly performance
01/02

100
95
90
85
80
75
70

99,80%

92,50%
96,40%
99,80%
92,50%
97,80%
91,25%
97,80%
DDR3
Alert: 99,75%
DDR4
Target: 99,50%
DDR5
Target: 99,75%
FLASH GS DDP
Target: 99,50%
Flash SSD DDP
Target: 99,50%
Flash GS QDP
Target: 97,50%
Flash SSD QDP
Target: 99,50%
EMCP / EMMC
Target: 97,50%

Welcome back!
You're at Adata 360 Portal! Check out the latest updates or log in to get access to all Adata products.




serranohub.com


English


Eduarda Oliveira
Product Designer


DDR4
DDR3
Flash GS DDP
Flash SSD DDP
Flash GS QDP

01/02


DDR3
|
Annual product performance
Reference date: November 2023 - October 2024

1500
1250
1000
750
500
250
0

Yield

Target

Alert

Output

Output
(until production)


Current Alert: 99,75%


94,63%
99,75%
99,75%
99,75%
99,15%
96,35%
99,65%
99,50%
96,12%
99,62%
97,34%
99,85%
1001
250
740
1001
248
702
1000
500
263
741
2000
1452
Nov
Dec
Jan
Feb
Mar
Apr
May
Jun
Jul
Aug
Sep
Oct
99,99%
99,98%
99,97%
99,96%
99,95%
Overview
|
Monthly performance
01/02

100
95
90
85
80
75
70

99,80%

92,50%
96,40%
99,80%
92,50%
97,80%
91,25%
97,80%
DDR3
Alert: 99,75%
DDR4
Target: 99,50%
DDR5
Target: 99,75%
FLASH GS DDP
Target: 99,50%
Flash SSD DDP
Target: 99,50%
Flash GS QDP
Target: 97,50%
Flash SSD QDP
Target: 99,50%
EMCP / EMMC
Target: 97,50%

Welcome back!
You're at Adata 360 Portal! Check out the latest updates or log in to get access to all Adata products.


Leasons learned
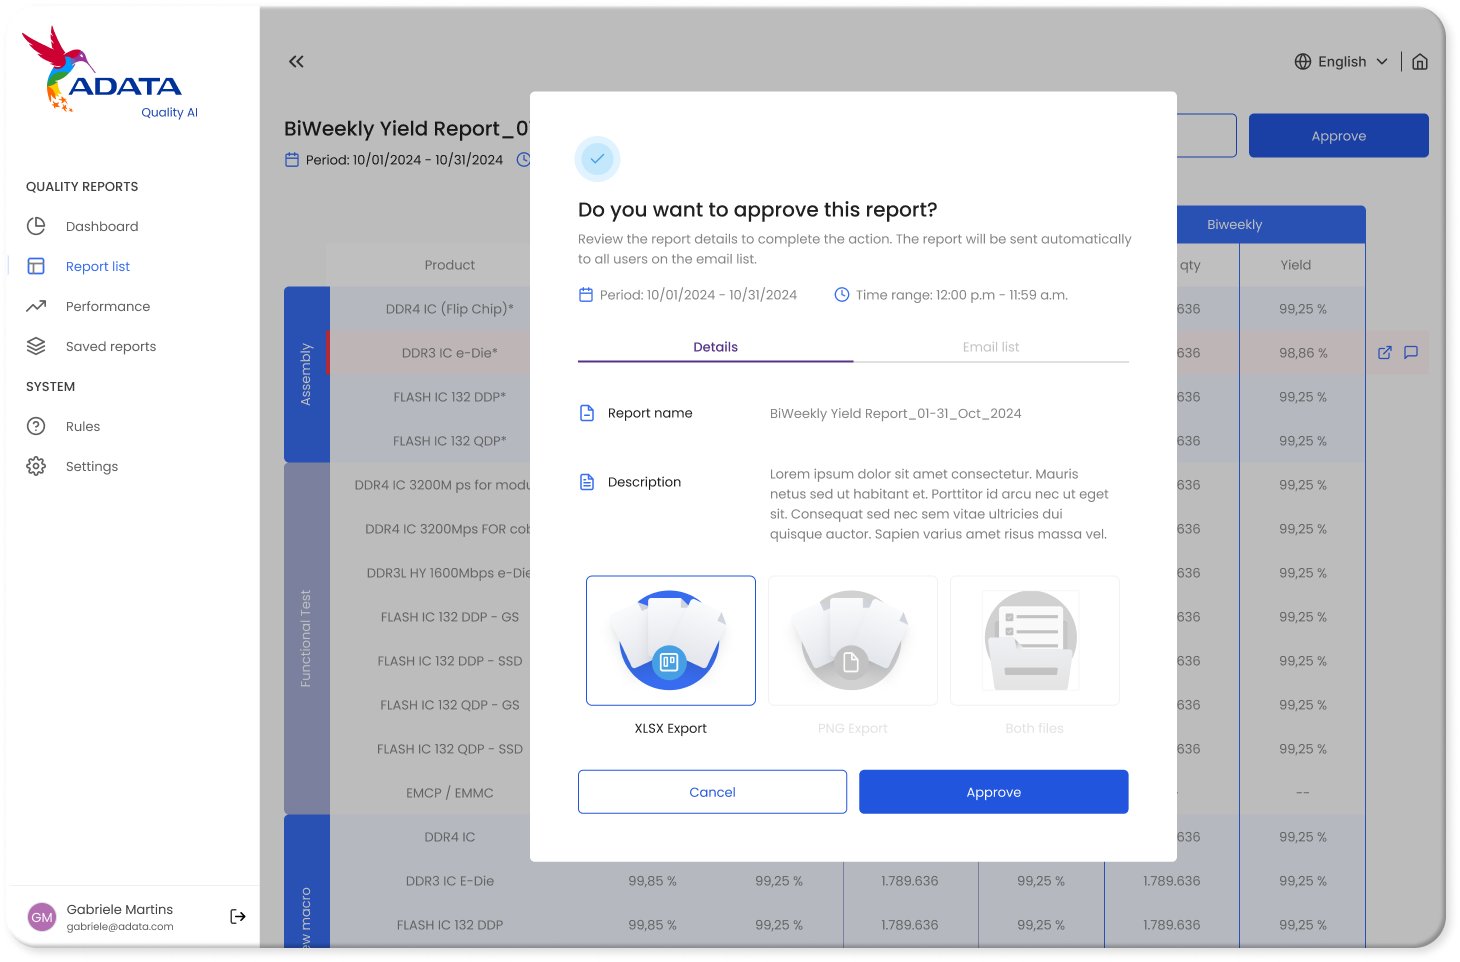
The Quality Report stands as a testament to how an end-to-end design process can transform critical operational workflows. By eliminating bottlenecks, reducing risks, and enhancing scalability, we turned complex requirements into a simple, intuitive, and secure interface that directly boosted business efficiency and quality.
The problem

Iterativity and Flexibility
Complex projects demand constant adaptation and collaborative validation. New requirements are inevitable and must be managed with agile responsiveness.

The Value of Documentation
Figma ecosystem served not just as a prototyping tool, but as the official repository for business rules and workflow, crucial for maintaining alignment between design and development.

Effective Communication
Close stakeholder engagement and continuous dialogue with the technical team were vital to project success, ensuring everyone stayed aligned and informed.
The road ahead
Looking ahead, our next steps include scaling the solution with additional automation features, further refining user experience through continuous iteration, and deepening data integrations to provide even more actionable insights. Our vision is to evolve this platform into a dynamic, user-centric ecosystem that anticipates future needs, driving innovation and ensuring sustained product excellence.
